Transportation
3 minute read
Transport emissions: are we seeing the big picture?
Transport is responsible for a quarter of global greenhouse gas emissions. We need solutions that will reduce these emissions – now. But how should we calculate the emissions from transport?
In order to identify the most effective solutions to reduce emissions, we rely on greenhouse gas emissions data. However, there are different ways of calculating emissions and, depending on the approach used, the results can be substantially different.
Tailpipe emissions
Perhaps the most common approach is measuring tailpipe emissions. Here, only the emissions generated from using the vehicle are measured. If we took the tailpipe data alone, hydrogen and electricity seem like the obvious choice, while the emissions related to fossil and renewable fuels appear to be very similar. However, this only covers a very narrow slice of what is a much bigger and more complex picture. It also does not take into account the circular nature of renewable fuels.
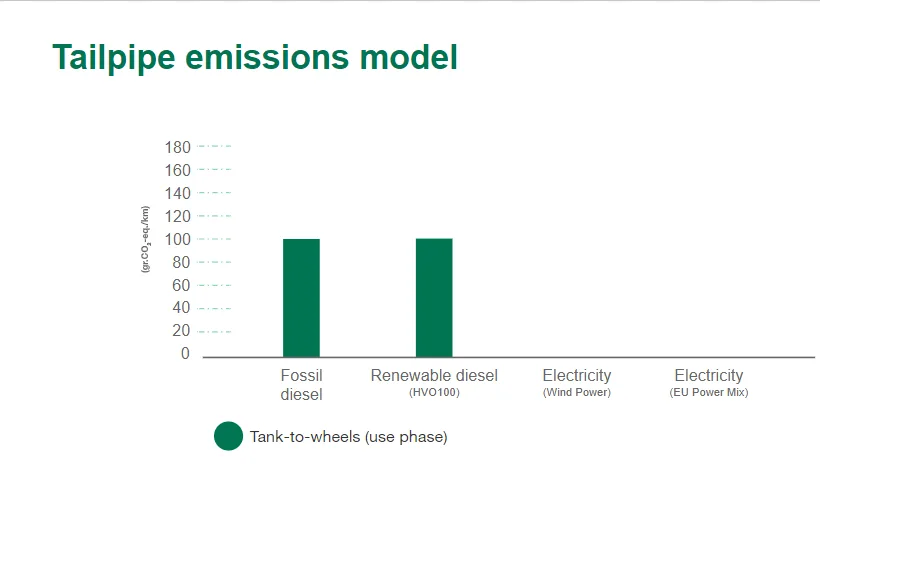
Data for midsize passenger car (Source: Volkswagen & Neste)
Well-to-wheels
The second approach is a “well-to-wheels” analysis that gives us a wider view of the upstream greenhouse gas emissions related to the entire value-chain of the energy carrier. This would, depending on the respective solution, include the extraction or sourcing of raw materials, the refining or production process and all transport and distribution, as well as the tailpipe emissions that were discussed earlier.
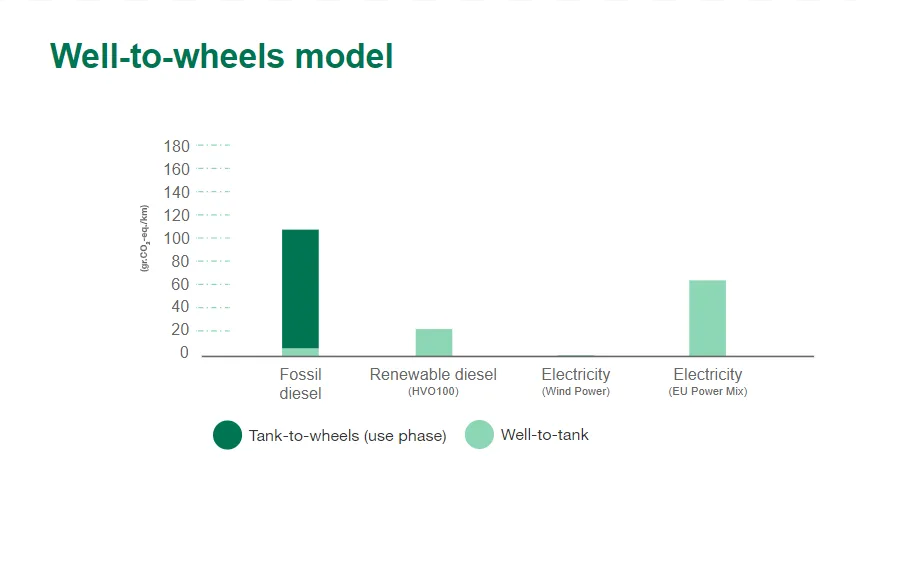
Data for midsize passenger car (Source: Volkswagen & Neste)
As we can see, a well-to-wheels analysis gives us a broader, more holistic perspective. And, consequently, very different results when comparing solutions. When taking into account the circular nature of renewable fuels, the picture changes dramatically. In fact, vehicles running on renewable fuels actually produce less greenhouse gas emissions than comparable electric vehicles based on the European Union’s current power mix. Yet, this is still not the whole picture.
Third approach
The third approach includes the greenhouse gas emissions data from the first and second, with the important addition of the emissions from the production of the vehicle itself. The production of each type of vehicle has a specific carbon footprint. This data becomes particularly relevant when looking at components that are carbon-intensive, such as batteries.
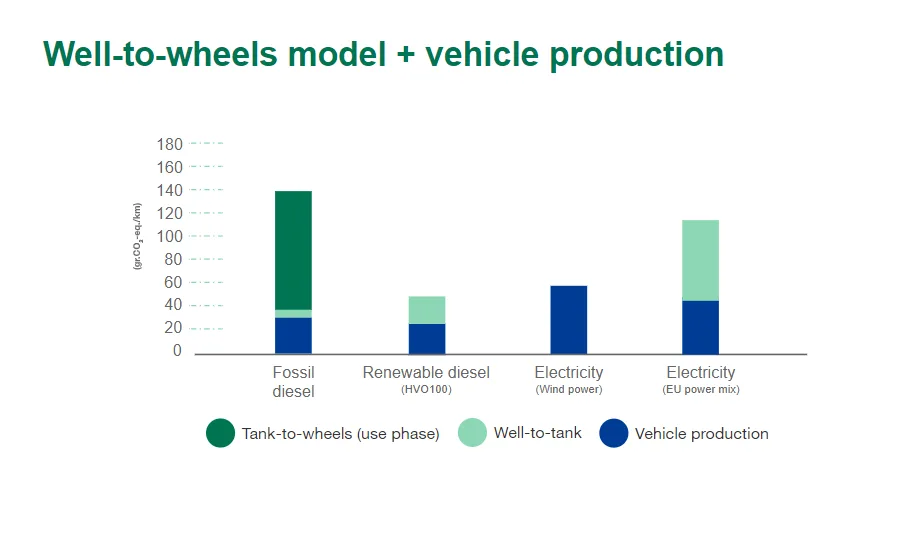
Data for midsize passenger car. Production in the EU and 200.000 km use. (Source: Volkswagen & Neste)
When taking into account vehicle production-related emissions, even in a scenario where all electricity production were to be decarbonized, the emissions of using renewable fuels would still be lower than that of electric vehicles.
Renewable fuels, such as Neste MY Renewable DieselTM, are the most cost-efficient solution to reduce transport emissions immediately. Their distribution relies on the existing infrastructure, and they can be used in the existing vehicle fleet.
In many countries, policymaking is not always based on a complete picture, which could lead us to miss out on a really important opportunity to reduce emissions. Focusing on the big picture helps us make the right choices.